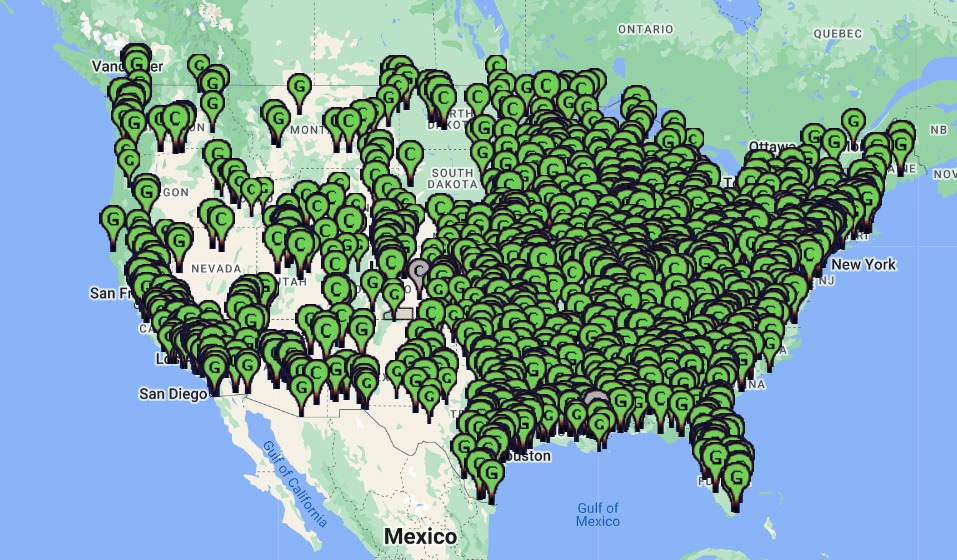
The following data is from the U.S. Environmental Protection Agency’s 2010 eGRID database, which has data for all electric generating plants in the U.S. Our copy of this data, organized to produce the charts below, is available here.
[Note that, while this data makes natural gas look clean, it’s only looking at smokestack emissions. Natural gas has greenhouse gas emissions worse than coal due to methane leakage from extraction to use, and landfills are also much worse than appears here because much of their emissions are from unfiltered toxic landfill gas escaping capture and leaking directly into the air.]
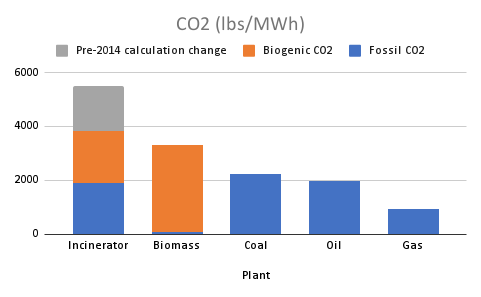
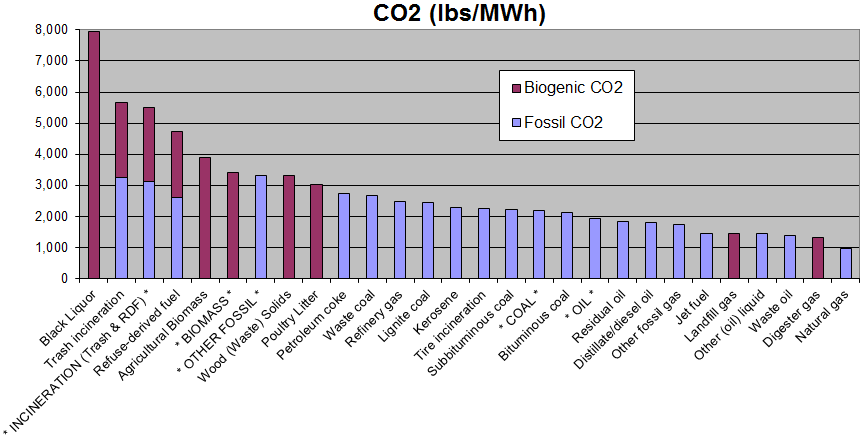
The purple color on the CO2 chart is the “biogenic” fraction of CO2, which is real CO2 emitted into the atmosphere, though agencies still count it as zero even though science and the courts have both concluded that this CO2 is not carbon neutral in any meaningful time frame, and ought to be counted.
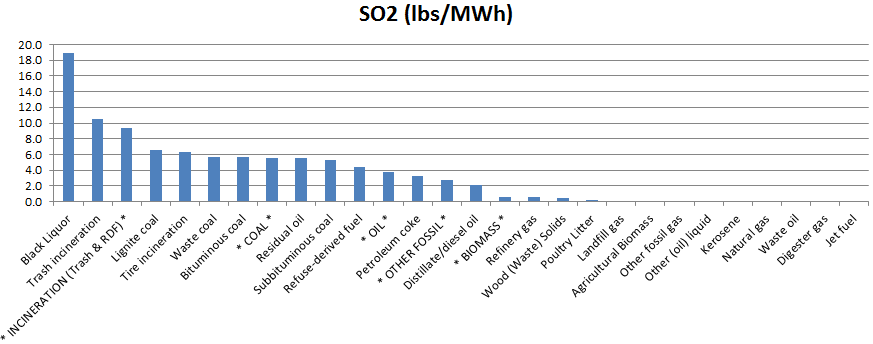
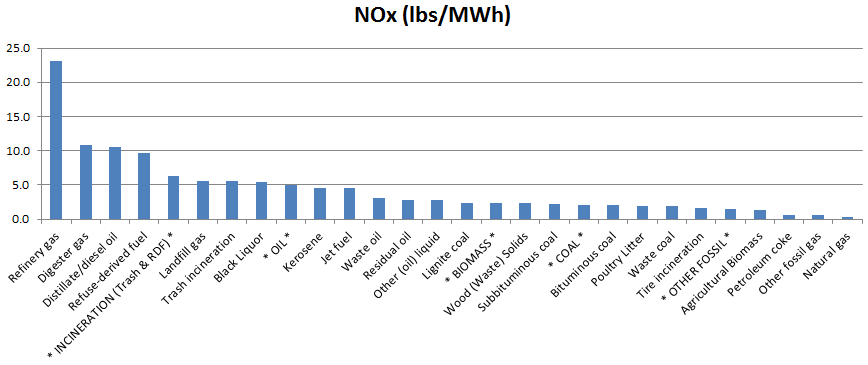
Broken out in more detail by what is burned…
KEY:
The broad categories listed in *ALL CAPS* are combined as such (# of facilities are in parenthesis):
- BIOMASS includes Agricultural biomass (2), Black liquor (1), Other biomass solids (1), Poultry litter (1), and Wood / Wood Waste (49).
- COAL includes Bituminous coal (194), Lignite coal (17), Subbituminous coal (158), and Waste coal (14).
- INCINERATION includes Trash incinerators (50) and Refuse-derived fuel (RDF) facilities (9).
- OIL includes Distillate/diesel oil (319), Jet fuel (31), Kerosene (13), Petroleum coke (7), Residual oil (16), Refinery gas (5), Waste oil (4).
- OTHER FOSSIL includes Blast Furnace Gas (1), Other (oil) liquid (1), Other fossil gas (1), Other fossil solids (1), and Tire-derived Fuel (2).
The numbers of facilities in the other categories are:
Digester gas (7)
Landfill gas (257)
Natural gas (861)
METHODOLOGY:
We arrived at these numbers by evaluating 2,022 electric generating facilities in the U.S. from the plant-level data in the eGRID v.9 database. The PLNT10 table in the database has 5,587 facilities, many of which had to be excluded to do this comparison. Exclusions are as follows:
- Facilities that don’t burn anything: we ruled out 2,196 facilities because they are primarily facilities that use nuclear power, geothermal, wind, solar or hydroelectric, or use purchased heat/steam. We relied on the PLPRMFL and PLPFGNCT fields for this.
- Facilities burning multiple fuels: We ruled out another 497 facilities because they burn more than 5% of a different fuel. We did this so we could do an honest comparison of emissions from a fuel type. For this, we relied on these fields: PLCLPR, PLOLPR, PLGSPR, PLNCPR, PLHYPR, PLBMPR, PLWIPR, PLSOPR, PLGTPR, PLOFPR, PLOPPR. Note that trash incinerators (MSB) are classified as burning a combination of fossil and non-fossil resources, but most are still burning primarily trash (or processed trash, known as refuse-derived fuel), so we coded these as MSW and left them in. The only exception to this 5% exclusion rule is for the Exeter Energy LP facility that burns tires in Sterling, CT and co-fires 8.8% oil and gas (mainly gas). This was included in order to get more accurate data on tire-derived fuel burners, since there is only one other (smaller) facility burning just tires. The effect of including Exeter actually drastically lowered the average emissions for tire-derived fuel burners.
- Facilities using combined heat and power: We excluded another 482 facilities that generate steam heat in addition to electricity if their power-to-heat ratio was < 10.0. In other words, we excluded those that aren’t primarily making electricity. This was done to ensure that we can make comparisons in terms of pollution per amount of electricity produced without overestimating pollution levels by failing to account for significant amounts of energy produced in the form of steam heat instead of electricity. We relied on the USETHRMO and PWRTOHT fields, where PWRTOHT <10.0.
- Facilities not generating any electricity in 2010: Another 390 facilities were excluded because they generated no electricity in 2010. For this, we relied on the CAPFAC field, where it was was negative or zero (most of these also show that PLNGENAN is negative or zero and many also show 0% of any resource mix). These are nearly all oil or gas burners.
A copy of the Excel file where these eGRID numbers are crunched, can be found here. The exclusions above are catalogued in colums D through G, and the excluded data is still available below row 2,029. Fields used in the analysis are marked in row 3 as “new” (fields we added), “grouping” (fields used to categorize the facilities), “Excl” (fields used to exclude facilities as described above), and “data” (fields used in the data analysis).