
[All numbers are in trillion btus, and come from the U.S. Energy Information Administration's Energy Consumption by Sector (Tables 2.1a through 2.1f) data through 2021.]
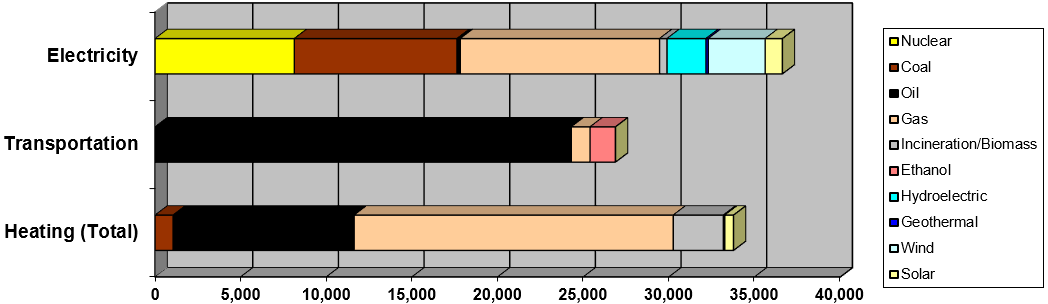
2021 U.S. Energy Consumption
There are three sectors of energy consumption: electricity (37.7%), transportation (27.6%), and heating (34.7%).
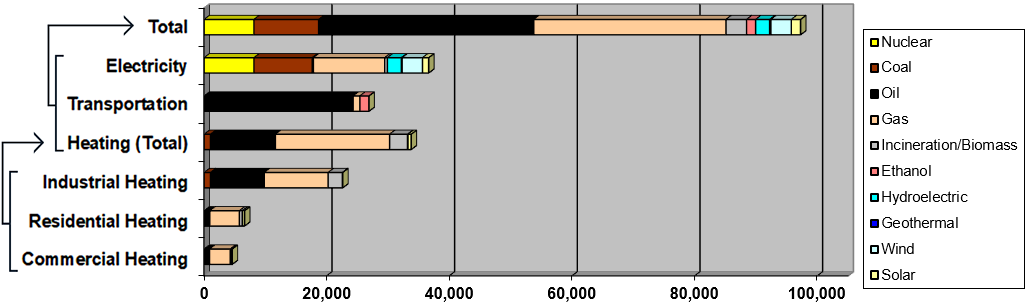
2021 U.S. Energy Consumption
The same above data, but totaled on the top line, and with heating broken out by sector of use. Heating of industrial processes (like paper mills, cement kilns, chemical plants and steel mills) makes up 67% of all heating sector use, and 23% of total U.S. energy use. Fossil fuels make up 79% of total U.S. energy use.
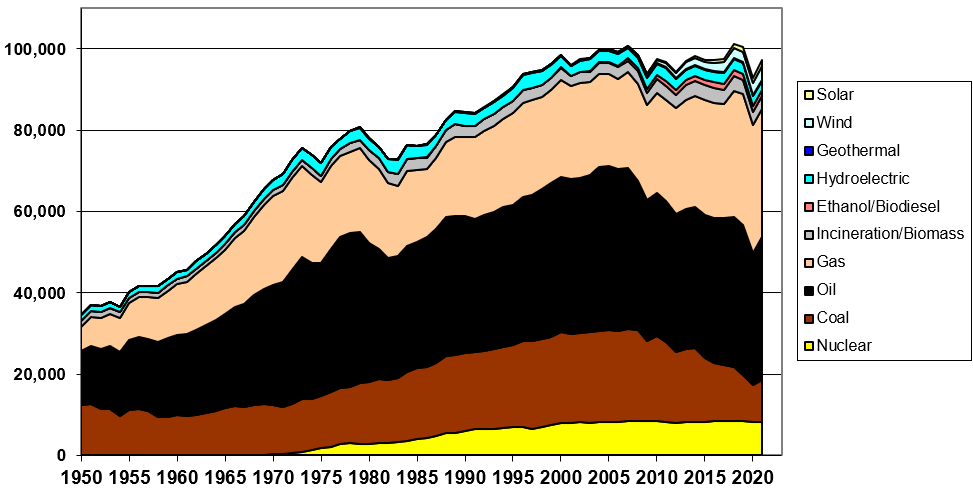
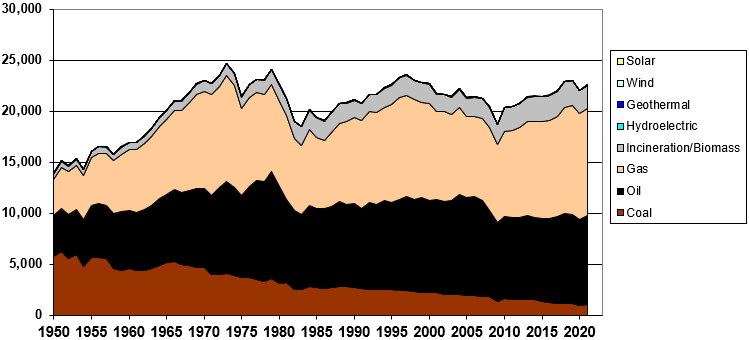
Total U.S. Energy Use by Fuel (1950-2021)
Energy use has nearly tripled, but has flattened out. The dip in 2020 was due to the pandemic.
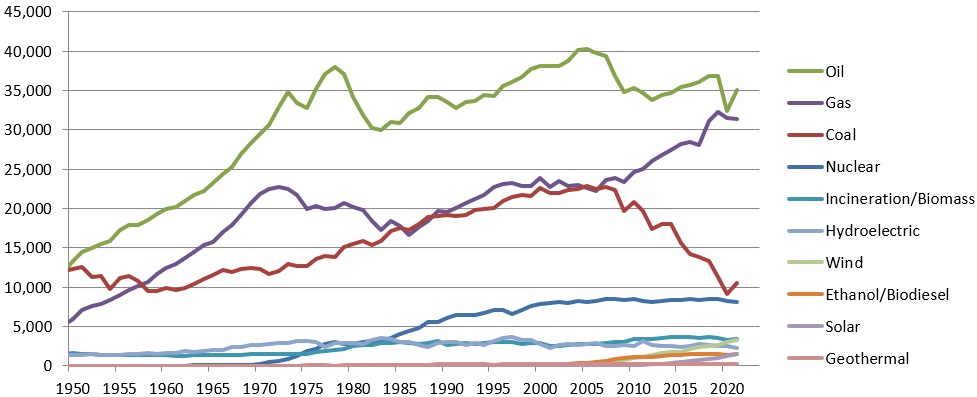
Total U.S. Energy Use by Fuel (1950-2021)
[Same data, but in line chart, not stacked.]
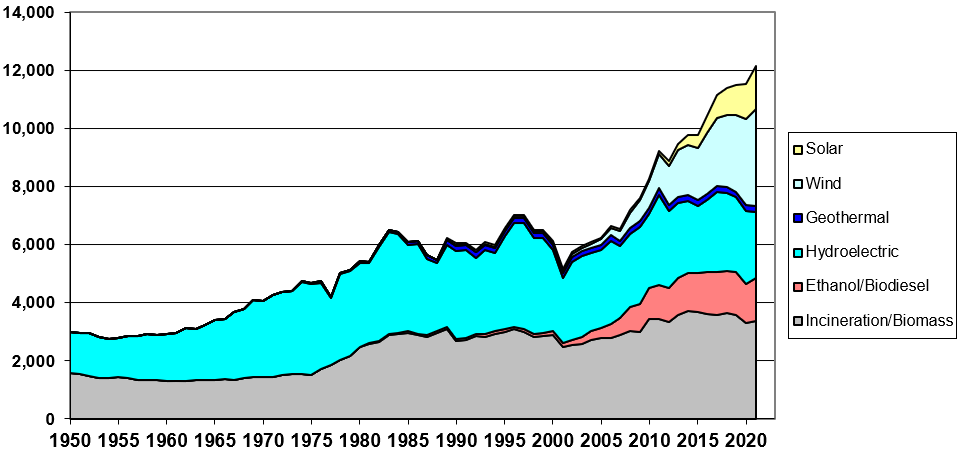
"Renewable" Portion of Total U.S. Energy Use
The "renewable" portion of the overall energy mix over time. 40% is still from polluting combustion sources (biomass/waste incineration and biofuels). The good news is that solar is growing most rapidly.
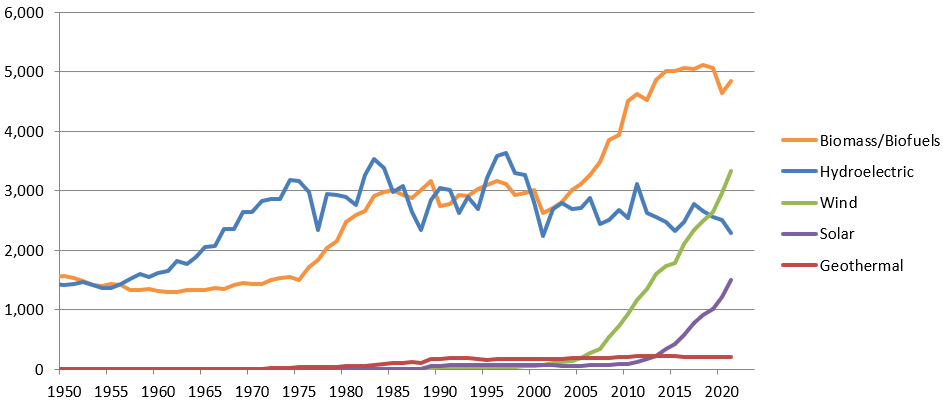
"Renewable" Portion of Total U.S. Energy Use
[Same data but in line chart, not stacked.]
Biomass/waste incineration and biofuels (ethanol/biodiesel) are combined in this chart to show that "bioenergy" is the largest "renewable" source and has grown rapidly, but leveled off since 2013. This chart also makes it clear that wind overtook hydroelectric in 2019 and that solar and wind are where the growth is.
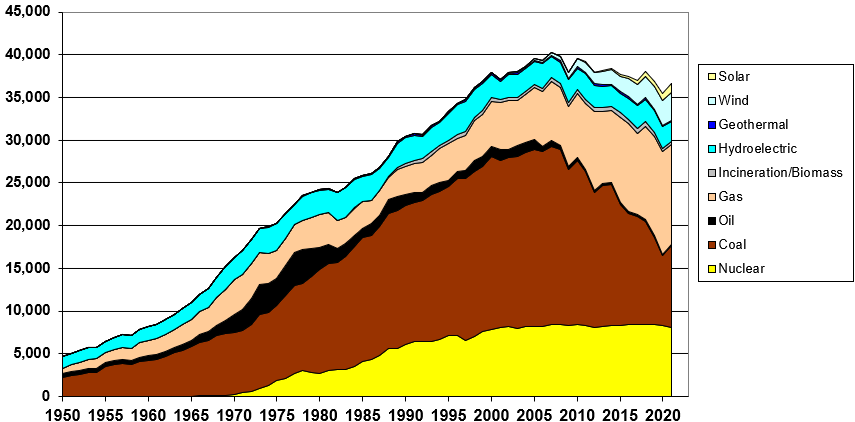
U.S. Electricity Use by Fuel (1950-2021)
The next four charts are just the electricity sector (not transportation or heating). The largest sources in 2021 are natural gas (32%), coal (26%), and nuclear (22%). Wind comes in at a distant 9%, but is rapidly increasing, as is solar (2.7%).
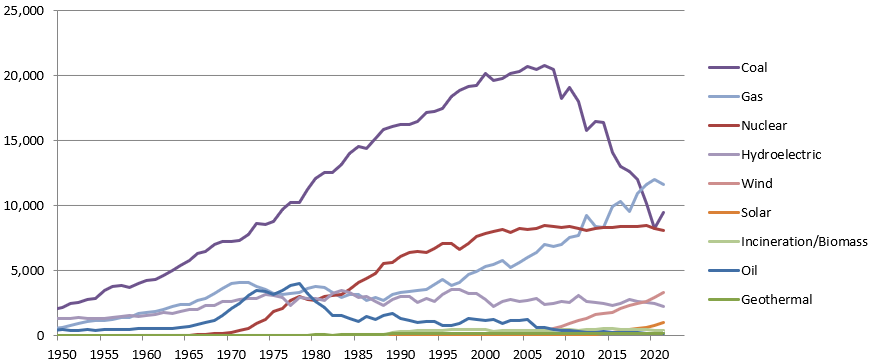
U.S. Electricity Use by Fuel (1950-2021)
[Same data, but in line chart, not stacked.]
Natural gas surpassed nuclear power in 2012 and overtook coal in 2019.
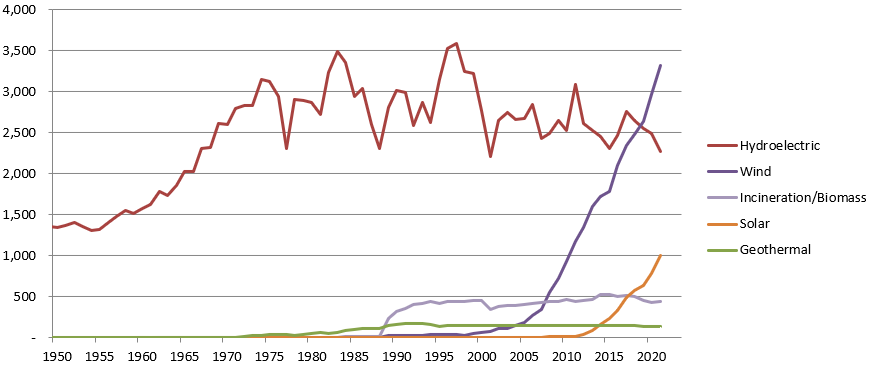
"Renewable" Portion of U.S. Electricity Use
The renewable electricity sector is now mostly hydroelectric and wind.

"Renewable" Portion of U.S. Electricity Use
[Same data, but in line chart, not stacked.]
Wind overtook hydro in 2019, and solar overtook biomass and waste incineration in 2018. Biomass and waste incineration flatlined and is falling, as the grassroots movement against biomass, built up by Energy Justice Network, has defeated about 50 proposed biomass and waste incinerators between 2010 and 2014, and our work against trash incineration has that industry on the decline. Poor economics and aging facilities are also causing incinerators to close.
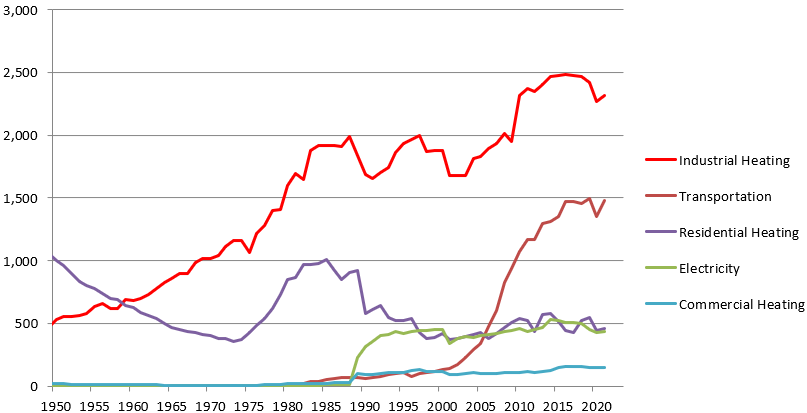
Industrial heating sources
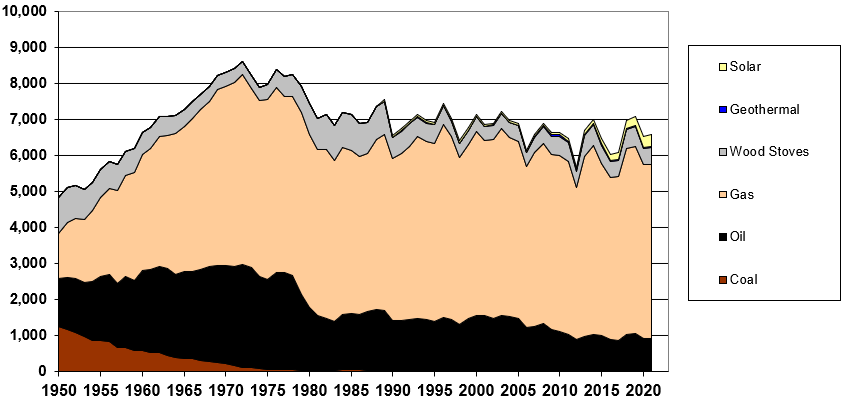
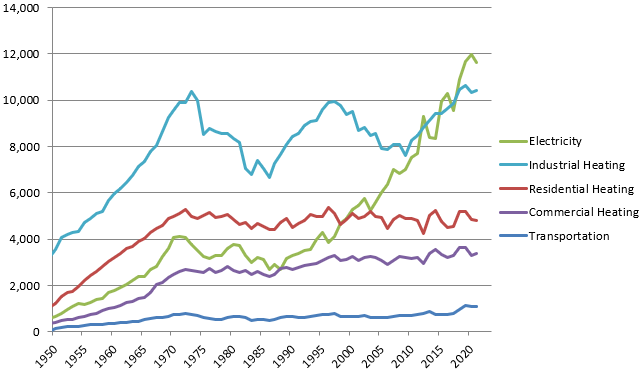
Residential heating sources
Residential solar heating is growing quickly and may overtake residential wood burning (and its serious pollution hazards) in the next few years.
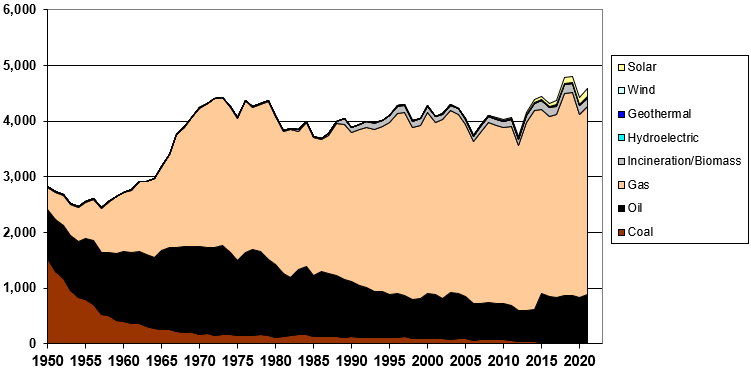
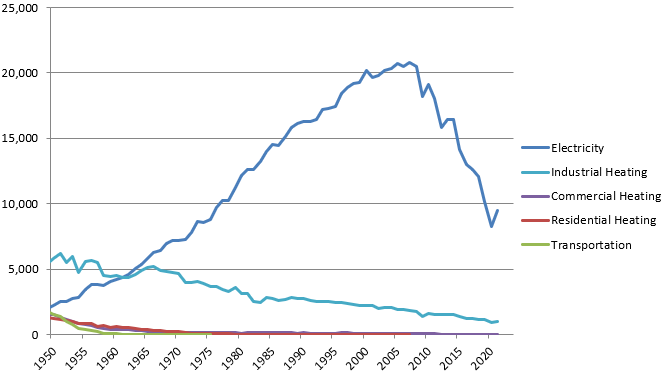
Commercial heating sources
Transportation energy use
As of 2021, 90.4% is oil. 5.5% is biofuels (ethanol and biodiesel) and 4.1% is natural gas. If you factor electric energy use into the total used for transportation, electric-powered transportation is only 0.08% in 2021.
Bioenergy use by sector
The biomass electricity sector would have increased dramatically since 2005 if not for the grassroots work we supported that stopped massive expansion of that industry.
2021 Bioenergy use, by sector

Natural gas use, by sector
Energy Justice Network was founded in the late 1990s to help communities fight off gas-fired power plants during the first of two major waves of gas-fired power plant development since that time. We've been warning that electricity (gas-fired power plants) would become the largest sector of demand for (mostly fracked) gas, but have been unable to get the coal-focused mainstream environmental groups or foundation funders to support grassroots work to stop this. Nonetheless, hundreds of proposed gas-fired power plants were blocked by grassroots groups, largely without such support.
Coal use, by sector
Energy Justice Network brought together a very active "No New Coal Plants" movement in 2006 that was the driving force that stopped the vast majority of over 200 proposals for new coal power plants around the 2004-2015 time frame. With coal production having peaked in the U.S. and escalating coal prices unable to compete with relatively cheap fracked gas (and now wind and solar), coal's continued decline is largely due to financial and geologic realities.
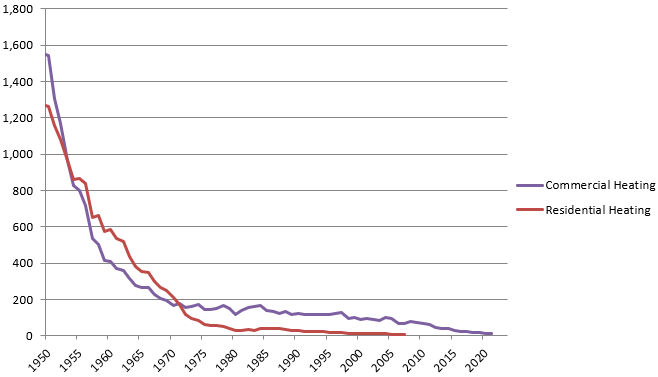
Coal use, by sector (residential and commercial heating close-up)
Trends: fossil fuel use declining; gas, wind and solar replacing coal
Some analysis from our review of the Planet of the Humans documentary...
From 2000 through 2019, U.S. population grew 17% as electricity consumption fell 2.6%, reflecting energy conservation and efficiency, which should always be higher priorities than any type of generation. Total energy consumption (electricity, transportation and heating) increased 1.6% in that time (because energy use in transportation and the commercial and industrial heating sectors increased), but 99.9% of wind and 62% of solar is serving the electricity sector, where energy demand is falling. So, more wind and solar does not mean more energy use.
The growth of wind and solar since 2000 came while coal, and fossil fuel use in general, fell.
In the U.S., coal use has declined dramatically, replaced more by fracked gas than renewables. The 26% drop in coal use for electricity was matched by gas, wind, and solar increasing by 27%. By total energy consumption, the 11.6% drop in coal use was matched by gas, wind, and solar increasing 11.6%.
| Share of U.S. Electricity Consumption by Fuel | ||||||||||
|---|---|---|---|---|---|---|---|---|---|---|
|
|
|
|
|
|
|
Incineration |
|
|
(coal/oil/gas) |
|
| 2000 | 21% | 3% | 53% | 14% | 0% | 0% | 1% | 7% | 0% | 70% |
| 2019 | 23% | 1% | 28% | 32% | 7% | 2% | 1% | 7% | 0% | 60% |
| Difference | +2.2% | -2.5% | -25.7% | +17.6% | +7.2% | +1.7% | +0.02% | -0.6% | +0.0% | -10.6% |
| Share of U.S. Energy Consumption by Fuel (Electricity, transportation and heating sectors combined) | ||||||||||
|
|
|
|
|
|
|
& Waste Incineration |
|
|
(coal/oil/gas) |
|
| 2000 | 8% | 39% | 23% | 24% | 0% | 0% | 3% | 3% | 0% | 86% |
| 2019 | 8% | 37% | 11% | 32% | 3% | 1% | 5% | 2% | 0% | 80% |
| Difference | +0.5% | -2.0% | -11.6% | +7.9% | +2.7% | +1.0% | +1.93% | -0.4% | +0.0% | -5.7% |